Note
Go to the end to download the full example code.
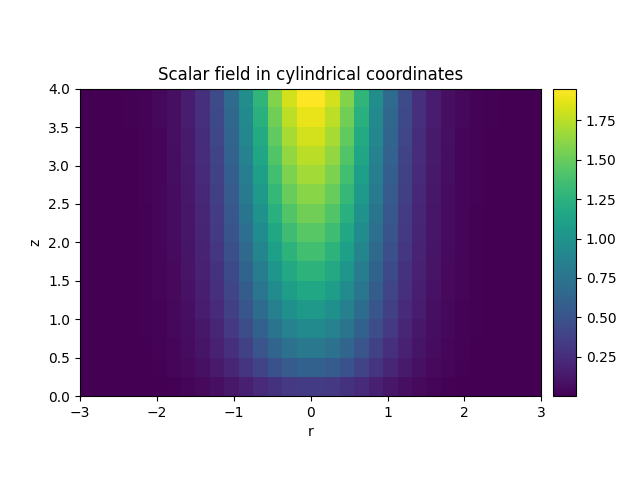
2.1.3 Plotting a scalar field in cylindrical coordinates
This example shows how to initialize and visualize the scalar field \(u = \sqrt{z} \, \exp(-r^2)\) in cylindrical coordinates.
from pde import CylindricalSymGrid, ScalarField

grid = CylindricalSymGrid(radius=3, bounds_z=[0, 4], shape=16)
field = ScalarField.from_expression(grid, "sqrt(z) * exp(-r**2)")
field.plot(title="Scalar field in cylindrical coordinates")
Total running time of the script: (0 minutes 0.106 seconds)