Note
Go to the end to download the full example code
2.1 Plotting a vector field
This example shows how to initialize and visualize the vector field \(\boldsymbol u = \bigl(\sin(x), \cos(x)\bigr)\).
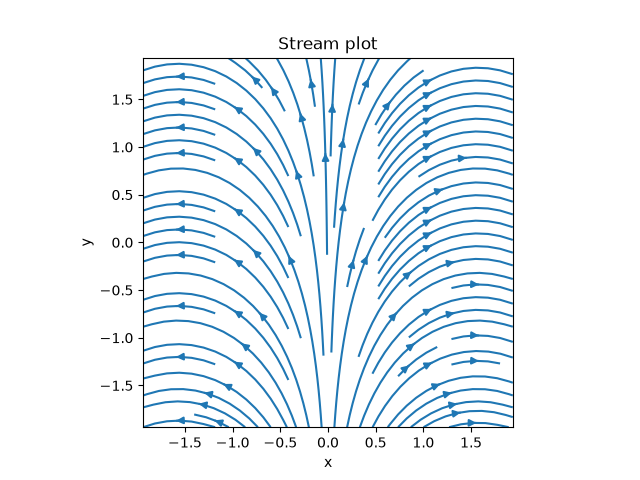
from pde import CartesianGrid, VectorField

grid = CartesianGrid([[-2, 2], [-2, 2]], 32)
field = VectorField.from_expression(grid, ["sin(x)", "cos(x)"])
field.plot(method="streamplot", title="Stream plot")
Total running time of the script: (0 minutes 0.553 seconds)